
The politics in America's Beef with Trump and the events in the companion timeline come down to two forces: prices that keep setting records, and a supply of cattle that keeps shrinking. This page charts both, using only official U.S. government series — the same BLS and USDA numbers the agencies and the trade press cite. Every series is monthly: no keyless weekly feed of these series was available to us (details in the note below), so monthly it is, clearly labeled. The data file behind the charts (data.json) is regenerated by a small script and carries its own source attribution.
Beef Prices at Three Levels of the Market
Three price series, indexed to 100 in January 2024 so they can share one chart despite different units: what shoppers pay for ground beef at retail (BLS), what packers charge for wholesale Choice boxed beef (USDA), and what feedlots receive for finished cattle (USDA, Nebraska fed steers).
Index, January 2024 = 100. Monthly averages. Hover any point for the underlying value and unit.
Beef Supply: Commercial Production
The supply side in one line: total U.S. commercial beef production per month, as compiled by USDA's Economic Research Service from federally inspected slaughter data. The decline from 2024 into 2026 is the shrinking herd showing up at the packing plant — and note the seasonal pattern underneath it (production typically peaks in late spring and fall).
Million pounds per month, commercial (federally inspected plus other inspected) beef production.
How to Read This
- Three different “beef prices” exist. Cattle prices are what ranchers and feedlots get per hundredweight of live animal; the boxed-beef cutout is what packers get per hundredweight of wholesale cuts; the BLS series is what you pay per pound at the grocery store. They move together over time but not in lockstep — margins and lags sit between them.
- The price chart is indexed, not in dollars. Because the three series have different units ($/lb vs. $/cwt), each is set to 100 in January 2024. A point at 130 means “30% above January 2024.” Hover points for the actual dollar values.
- Wholesale and cattle series are proxies for retail pressure, not retail prices. A falling cutout or cattle price does not mean your grocery bill falls the same week — retail lags wholesale by weeks to months, and retailers set shelf prices.
- Production is not herd size. Monthly production also reflects how heavy cattle are when slaughtered and how many days plants ran. USDA's herd counts (the 75-year-low inventory figures) are in the timeline.
build-data.py and stored in this directory's
data.json. Specifically: (1) BLS average retail price, 100% ground
beef, $/lb (FRED series APU0000703112); (2) USDA ERS boxed beef cutout, Choice 1–3,
600–900 lb, Central U.S., $/cwt; (3) USDA ERS Nebraska fed steers, 65–80% Choice,
$/cwt — a major feedlot-market cash price used as the cattle-price series; (4) USDA ERS
commercial beef production, million pounds. We attempted keyless weekly series (CME live
cattle futures via Yahoo Finance, stooq, and CME's own quote API, plus weekly slaughter
reports) and could not obtain any reliably from this server — Yahoo rate-limits, stooq
requires a browser JavaScript challenge, and CME blocks this server's IP — so weekly
charts were not possible and nothing here is extrapolated or fabricated to look weekly. USDA
ERS figures for the most recent months are preliminary and are revised in later releases. The
live cattle-futures ticker on the parent article is a separate, delayed quote and is labeled
as such there.
Sources
- BLS via FRED — Average price: 100% ground beef, per pound (APU0000703112)
- USDA Economic Research Service — Livestock and Meat Domestic Data (wholesale prices, livestock prices, meat statistics; machine-readable CSVs)
- U.S. Bureau of Labor Statistics — average retail food price series
- America's Beef with Trump — the analysis these charts support
- American Beef, 2024–2026 — the sourced timeline behind the numbers
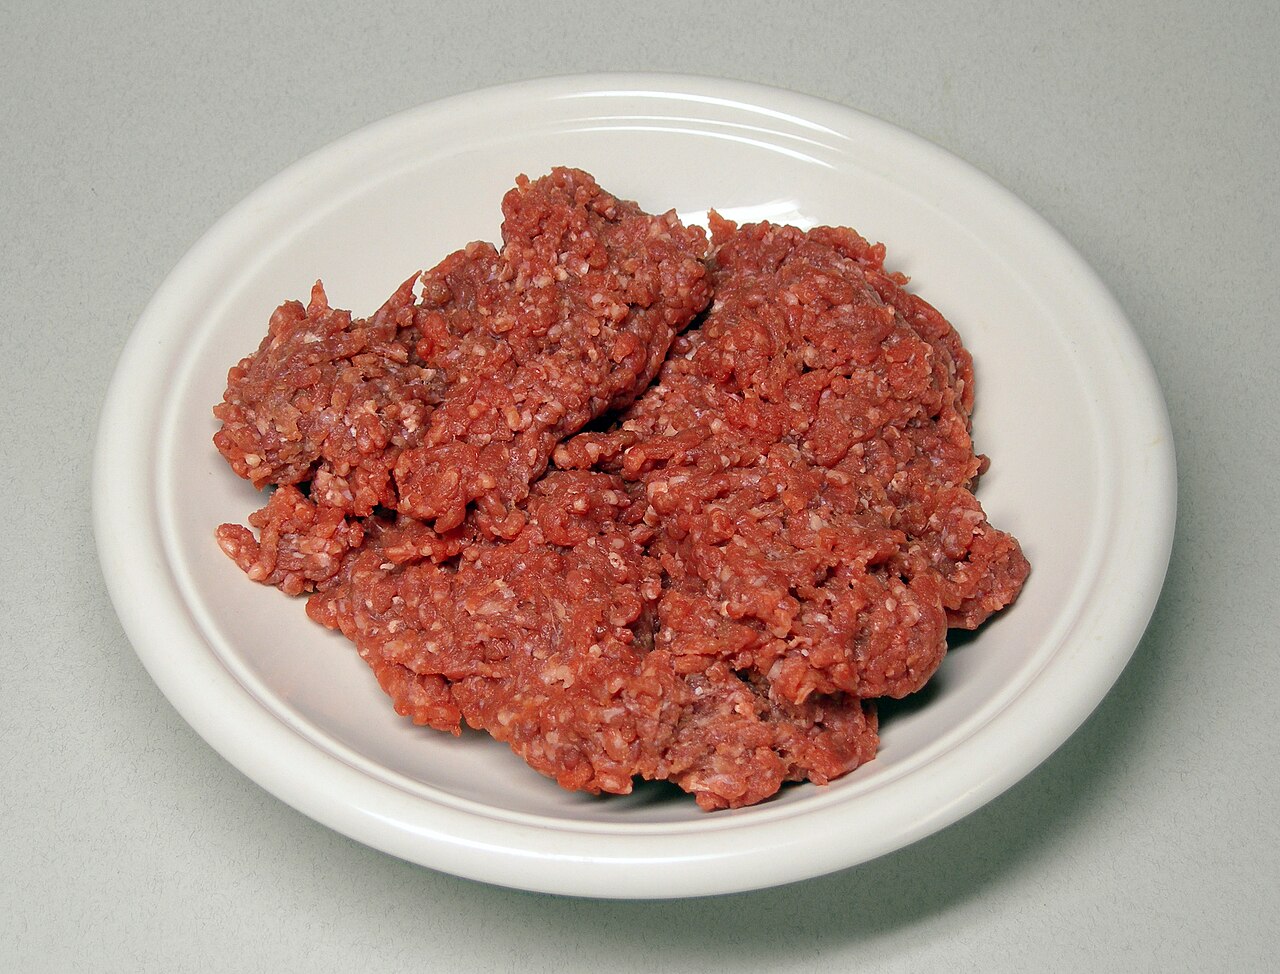
Image credits: raw ground beef — Rainer Zenz, CC BY-SA 3.0, via Wikimedia Commons.
Discussion (0)
Join the discussion. Pick a name and your party — that’s the whole signup. Comments are color-coded: Democrat Independent Republican. No links, no slurs — disagree like a citizen.
No comments yet — be the first.
Comments are the sole responsibility of their authors and do not reflect the views of CommonHouseParty.org. Party labels are self-declared and unverified — they describe what a commenter chose at signup, nothing more. Accounts are name-and-party only, so identity cannot be guaranteed. We may remove comments that contain links, slurs, personal attacks, or private information, and repeat abuse may be blocked. We log the IP address of every signup and comment for abuse prevention and moderation; these logs are not published. By posting, you grant us permission to display your comment on this page.